Read the dashboard
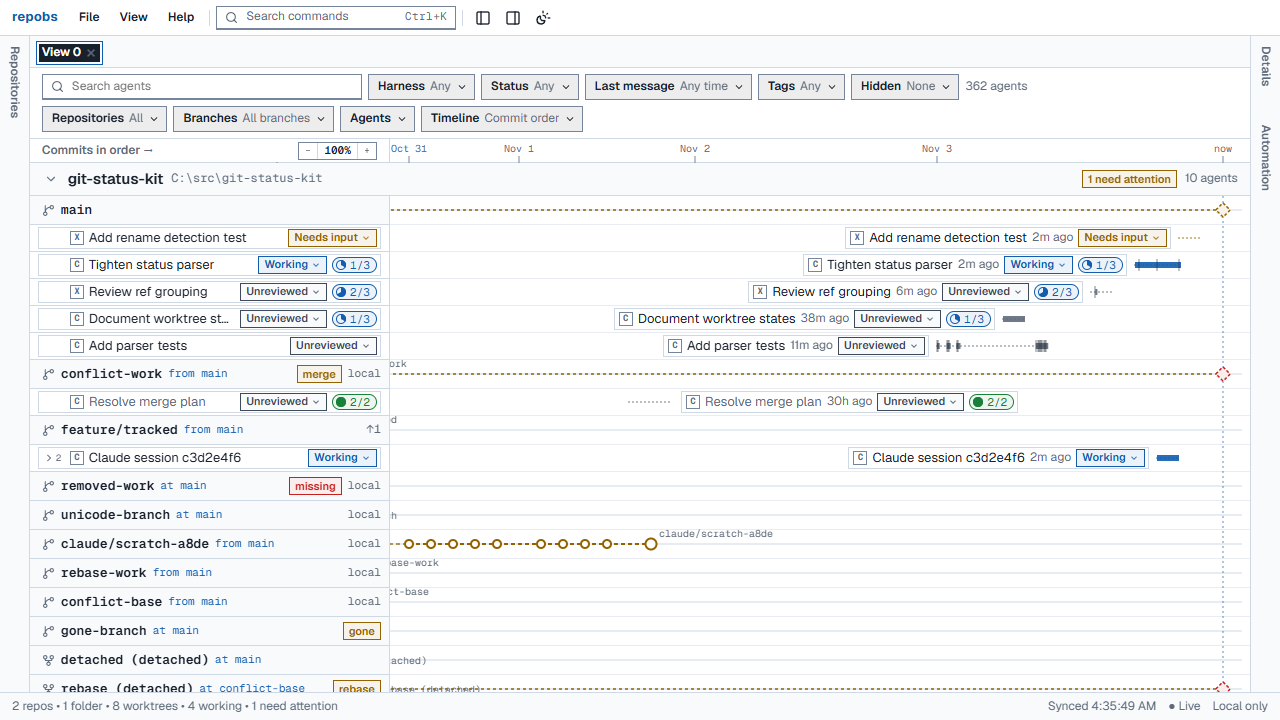
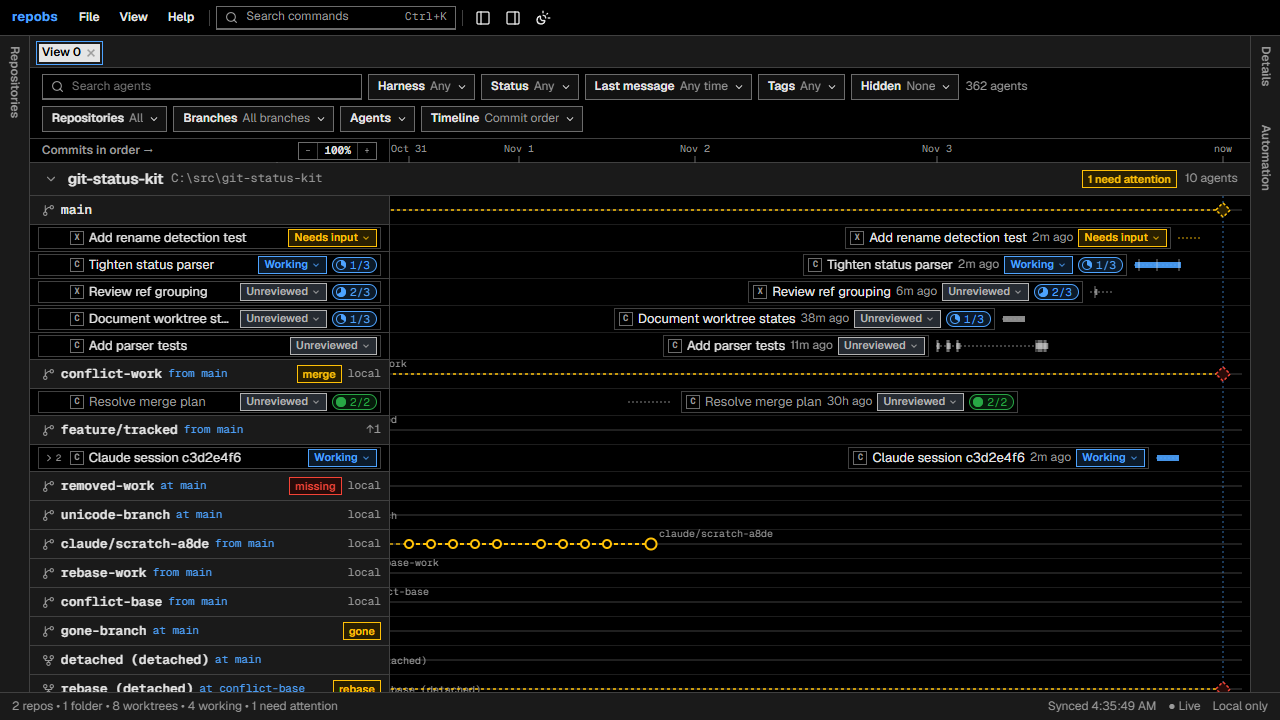
Each repository is a section of the dashboard. Its branches are rows on the left, with the agents that worked on each branch under it. The history runs from left to right, with now at the right edge.
Branches and commits
- One row per branch. The checked-out branches come first, then the other local branches, detached worktrees and Unassigned sessions.
- The label says how a branch relates to another: from main (it started from
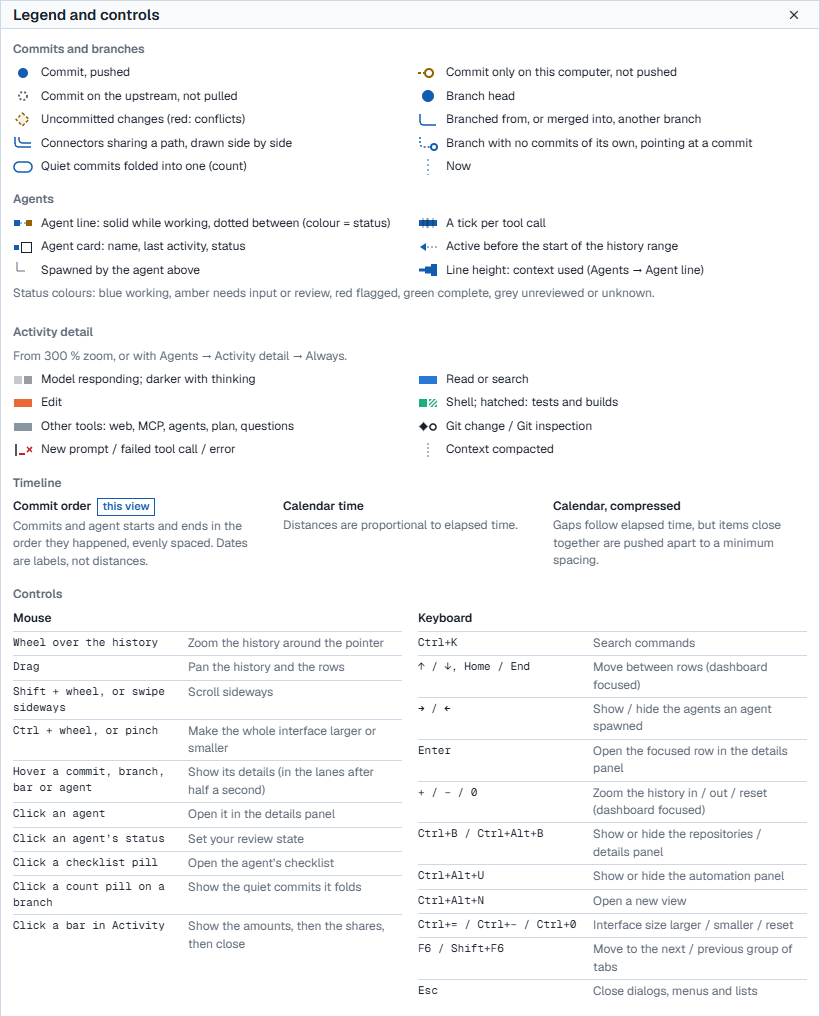
main), → main (it was merged intomain), at main (it has no commits of its own and points at a commit onmain). - Commits are dots on the branch's row. Lines connect each commit to its parent; a fork drops from the commit it started from, a merge turns into the merge commit.
- The style of a dot shows where the commit is:
- filled: pushed;
- hollow amber with a dashed line: only on this computer;
- grey dashed: on the upstream, not pulled yet.
- A dashed diamond after a branch head means uncommitted changes in its worktree (red: conflicts).
Hover a commit for its message, id, date and push state:
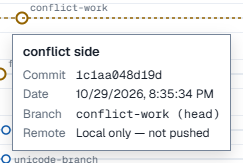
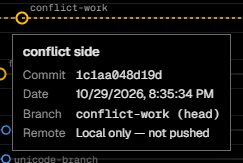
Hover a branch label for its upstream and worktree, and a diamond for the changed files.
Fold quiet commits
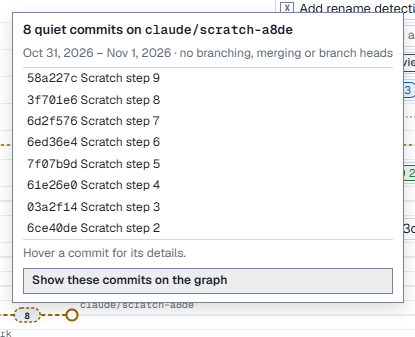
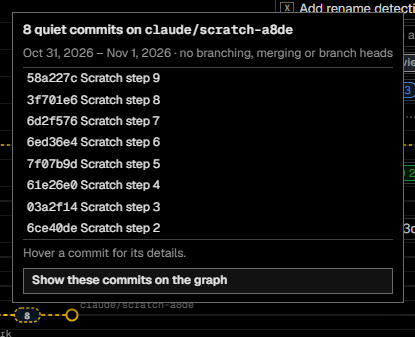
Long runs of plain commits can take a lot of room. Choose Branches → Collapse quiet commits to fold each run into one pill with a count. Hover the pill to list its commits; click it to show them again.
Choose the timeline
The Timeline menu sets how history is spread out and how far back it goes.
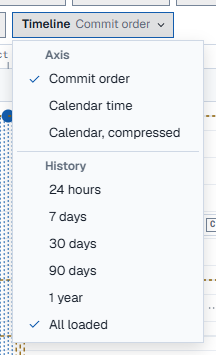
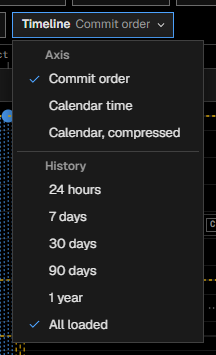
- Commit order: commits and agent starts and ends, evenly spaced in the order they happened. Dates are labels, not distances. Best for following what happened when.
- Calendar time: distances are proportional to elapsed time. Best for seeing how long agents worked.
- Calendar, compressed: like calendar time, but items close together are pushed apart so they stay readable.
- History: the last 24 hours, 7, 30 or 90 days, a year, or everything loaded.
Zoom and pan


- Zoom: turn the mouse wheel over the history, or use − and + beside the axis. Click the percentage to go back to 100 %.
- Pan: drag the history with the mouse in any direction, or swipe sideways on a touchpad.
- Make everything larger or smaller: Ctrl + mouse wheel, or Ctrl + = and Ctrl + −. Ctrl + 0 resets it.
Look up a mark
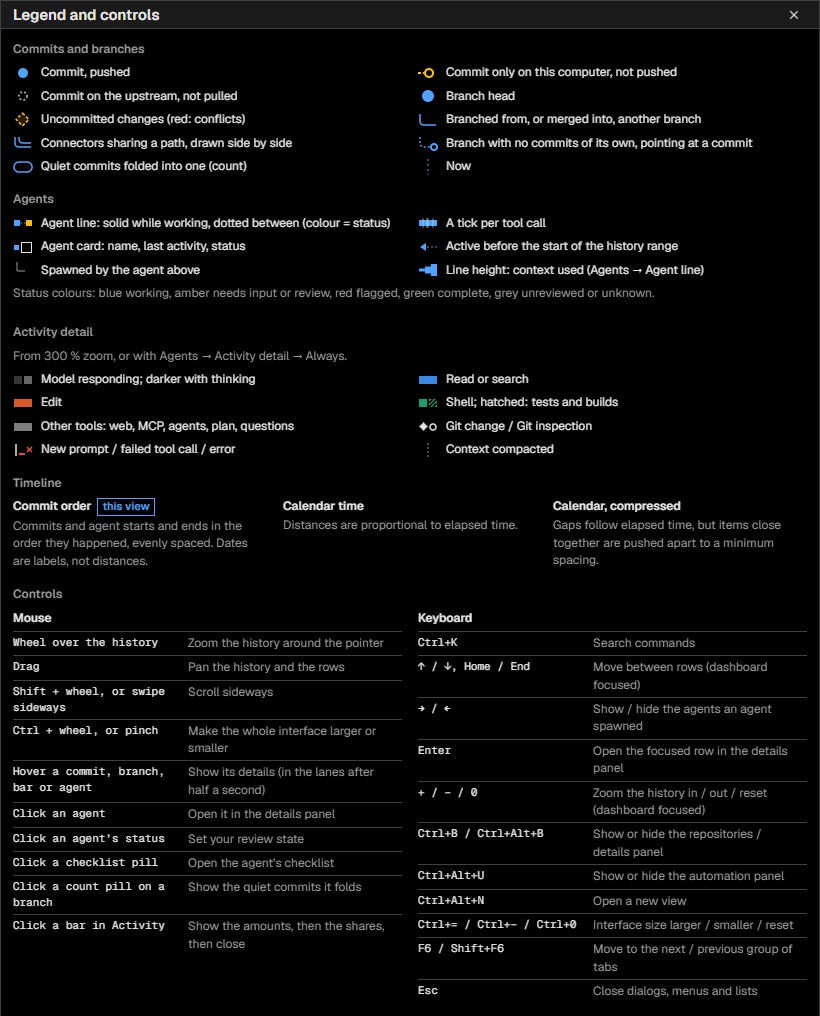
Open Help → Legend and controls for every mark on the dashboard and every mouse and keyboard control.
Next: Follow your agents