EnergyAtlas Wiki
Workflows
Quick Start Workflows Python WebAPI Library User Stories Wiki Guide
  • Workflows Overview
  • Input and Output
  • Data Preparation
  • GUI Workflows
    • Urban Data Integration
    • Spatial Data Preview
    • Template Definition and Assignment
    • Scenario Design and Simulation
    • Running and Calibrating
    • Results View
    • LiDAR Workflows
  • Shading Guides
    • Shading Guide Index
    • Voxelization and Sensors
    • Sunlit Fraction
    • Sky and Horizon View Factors
    • Incident Radiation

Workflows

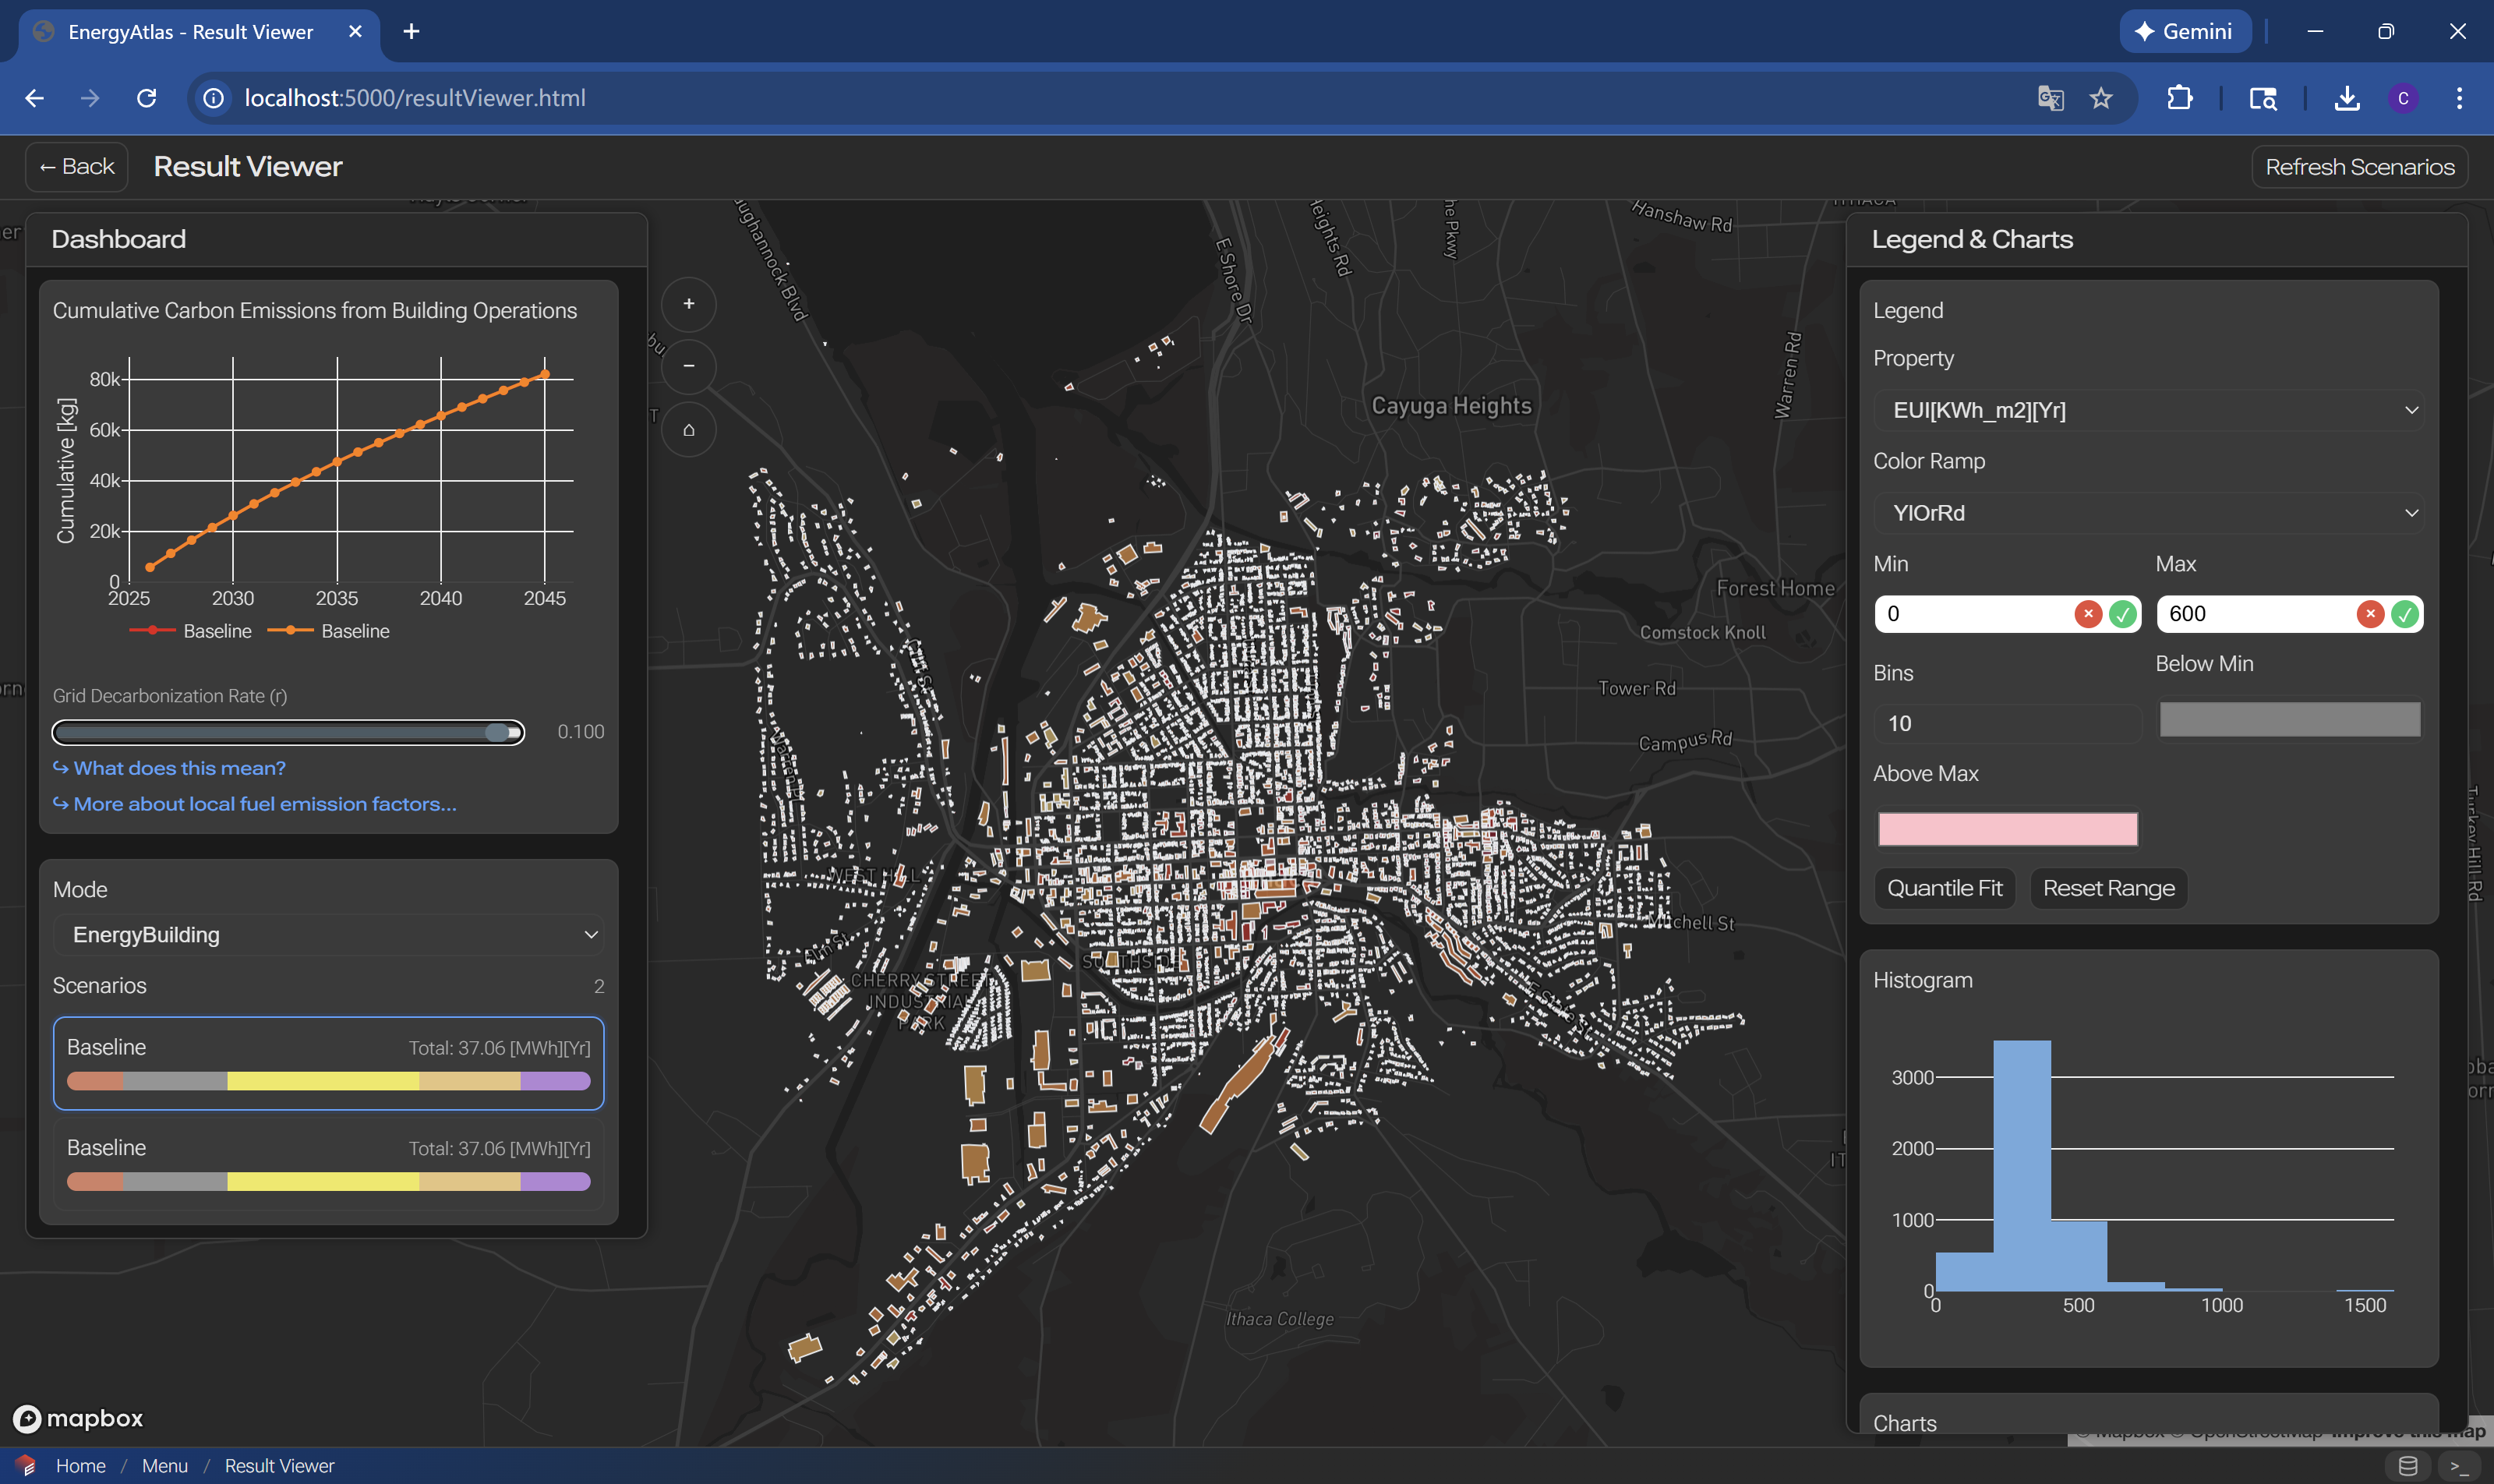
Results View

Workflow for analyzing, visualizing, and exporting simulation results in EnergyAtlas.

Overview

The results view workflow helps you explore simulation outputs, generate insights, create visualizations, and export data for further analysis or reporting.

Step 0: Carbon Projection
alt text

Results view panel is still under active development.

Please try the Urbano Viewer instead. Urbano is a free plugin to Rhinoceros 3D.

Next Steps

After analyzing results:

  • Scenario Design - Create new scenarios
  • Running and Calibrating - Refine models
  • Workflows Guide - Other workflows

Related Documentation

  • Input Output Guide - Export formats
  • Objects Reference - Data model
Running and Calibrating Previous LiDAR Workflows Next

Last page update GMT-04:00 05:00 Jul 19 2026
Last website update GMT-04:00 05:00 Jul 19 2026

Found an issue on this page? Please open an issue on GitHub.

On this page

  • Results View
    • Overview
    • Step 0: Carbon Projection
    • Next Steps
    • Related Documentation

WIP EnergyAtlas Wiki

EnergyAtlas Wiki is still under active development. Thank you for your patience while we improve the documentation. If you have any questions, please contact us.